|
Light, colours and colour models (RGB, HSB, CMYK)
In the photography and in the print area one has to do with colour models like RGB, HSB or CMYK every day. On this page we concern ourselves with the properties of such colour models in detail, how to visualize them, how to applicate them and which advantages they have. However, before we jump on the colour models we look at the origination and the structure of light.
The spectral colours of light
What is light? This question concerns humanity since primeval times. Does a light ray consist of small particles or is it simply a wave like a simple radio or walkie-talkie can receive?
There is a natural phenomenon which has fascinated the humanity ver and still creates enthusiasm for young and old people: a spelndid, widely spanned rain bow at the horizon of the sky. This colourful colour game, where one can see colours from violet over green and yellow until red going fluently into eachother, is nice to see again and again. However, it took until the 17. century that this phenomenon could be interpreted scientifically.
Isaac Newton was the big tinkerer, who could fragment white sun light into its spectral colour using a glass prism. From that moment it was well-known that white light is a mixture of a variety of singular colours. At a prism blue light is refracted strongly; red light only is refracted slightly. Between these two colours there is an infinite nomber of steps. So the light spektrum is generated from violet over blue, green, gelb and orange until red.
The effect, which Newton achieved with a glass prism, is the same phenomenon we can see in a rain bow. Small water drops or ice crystals refract the light in the same way a glass prism does.
Light as an electromagnetic wave
By the prism experiments from Isaac Newton the humanity leanred that white light is composed from many singular colours and that white light can be split into its spectral colours. But what actually is light, where does it come from and how does it propagate?
In the 19. century the physicians James Maxwell and Heinrich Hertz succeeded proving that light is an electromagnetic wave. But what exactly is an electromagnetic wave? According to James Maxwell an electrical field can create a magnetic field and vice versa. In an electromagnetic wave electrical energy and magnetic energy is converted cyclically. Compared to sound waves or water waves electromagnetic waves do not need a carrier, which means that an electromagnetic wave can also propagate in an evacuated room.
Thus light is an electromagnetic wave, which can spread in the evacuated universe. The velocity of propagation of such an electromagnetic wave is approx. 300.000 km/s, which is the value designated as the speed of light. The speed of the light is so high that it cannot be detected with the eye. A light beam would need only a bit more than a tenth of a second in order to orbit the earth. Even to the moon (approx. 400.000 km away from the earth) a light beam takes just a bit more than a second. A light ray becomes "slow" only if one thins astronomically. The light which our sun sends us every day takes almost 10 minuten, since the medium distrance of the sun to the earth is approx. 150 million kilometers. The star which is next to our solar system with the name Alpha Centauri is more than 4 light years away from us. Giving this distance in kilometer would result in a hardly readable, extremely large number, so that such distances are only given in light years. And even this star is just around the corner, if we contemplate the dimensions of the universe.
Light as a part of the electromagnetic radiation
Light consists of electromagnetic waves which propagate with the speed of light. Now somebody might note that an electromagneic wave is more such a wave which is received by a simple radio or a walkie-talkie. And electromagnetic waves are also those waves which warm up the lunch in the microwave. While such waves are invisible, light is something we can see!
Indeed a light wave differs from a radio wave or a micro wave not in its nature but only in the wave length or in its frequency, respectively. Everybody knows that a VHF radio station can be received in the frequency area between 87.5 and 108.0 MegaHertz. Walkie-Talkies have even lower frequencies. That's why electromagnetic waves in this frequency range are also called radio waves. Everybody also knows waves in the frequency range between 20 Hz and 30.000 Hz: These are sound waves.
In the Gigahertz range of the electromagnetic radiation there are the well-known micro waves, which not only propagate in kitche devies. Also the satellites of the GPS navigation system send in the micro wave range.
If we increase the frequency of the electromagnetic radiation more and more we finally get into the range of the x-ray range, then in the range of gamma radition (radio active radiation) an with frequencies over 1022 in the range of the cosmic radiation.
The part of the electromagnetic radiation which has a wavelength between 100 Nanometer and 1 Millimeter, respectively has a frequence between 1011 and 1016 Hertz, is designated as light. Now it becomes clear, why light is just a small part of the electromagnetic radiation.
Even light can be divided into a variety of singular ranges. The range of the visible light is just a small part of the range, which is generally designated as light. Visible light has a wavelength between 380 and 780 nano meter. An electromagnetic wave, which has a wavelength of 380 nanometer, can be percepted with the human eye as visible violet light. An electromagnetic wave with a wavelength of 780 nm can be seen as red light. Between these two wavelengts there is the complete visible colour spektrum from violet over blue, green, yellow and orange up to red.
But what is beyond the limits of the visible light, which is also designated as light? If we continue reducing the wavelength we get the ultra violet light (UV-A, UV-B, UV-C), which provides the brown skin in the summer vacation as it is well-known. In the other direction there is the infrared range, which is also called heat radiation.

Finally let us clarify the question how the wavelength and the frequency of electromagnetic waves are related to each other. It is the speed of light which is the quotient of the distance (wavelength λ) and the time (reciprocal value of the frequency f). With the speed of light we can calculate the frequency for a specific wave length. Example radio frequence with 108 MHz: λ = c/f = 300.000.000 / 108.000.000 = 2,8m. Example red light with 700nm wave length: f = c/λ = 300e6 / 700e-9 = 4,3e14 1/s.
How many colours do exist?
As visible light is designated that part of the electromagnetic wave, which has a wave length between 380 and 780 nanometers. Light with a wave length of 380 nm has a violet colour, light with a wave length of 780 nm has a red colour. In between there is the visible light spektrum. The two limits of 380 and 780 may lead to the assumption that there are 400 singular spectral colours. However, an electromagnetic wave also can have a wavelength of 475,162 nanometers. So we can see, that in the range of the visible light there is an infinite nomber of spectral colours.
White sun light contains all spectral colours in the visible range. One speaks from a continuous colour spektrum. A singular spectral colour with a specific wavelength can only be created by a laser.
Thus theoretically there is an infinite nomber of particual spectral colours. In nature one never sees a singular spectral colour, but always mixtures. From an arbitrary mix of an arbitrary nomber of spectral colours arbitrary many new colours can arise. So indeed there is an infinite nomber of colours. But that does not mean, that the human eye can percept all available colours or can even distinguish them.
Colour and colour perception
When I have written in the previous chapter that light with a wavelength of 780 nanometer has a red colour, it is not expressed completely correctly. Finally colour is not a physical variable but a physiological phenomenon. If an electromagnetic wave with a wavelength within the range of the visible light gets into our eye, a colour stimulation is triggered, which our brain processes to a specific colour perception. While an electromagnetic wave with a specific frequency is physically unitquely describable, colour is not absolute physical parameter, but rather a percepted stimulus of a sense. Example: There are optical illusions, where our brain percepts more colours than there are indeed.
So what does it mean when a red flower pot has the colour red? Physically seen the flower pot does not have a colour at all but only a specific absorption and reflextion capability, if it is illuminated by a light source. After all, the flower pot is as black as the environment in a dark room. Also the moom at the sky is black, if it is not illuminated by the sun.
If red flower pot is illuminated by white sun light this means, that the surface of the flower pot reflects the red parts of the light mixture while the other light parts are absorbed. In this way the red colour perception works.
What are colour models used for?
From an infinite nomber of spectral lights an infinite nomber of lights can occur by mixing them. At this point a consciously speak about lights, i.e. from electromagnetic waves, and not from colour perceptions. In no computer and in no optical-digital instrument an infinite nomber of lights can be displayed or be distinguished. That's why colour models are used which cover a most possible range of the possbile colour perceptions.
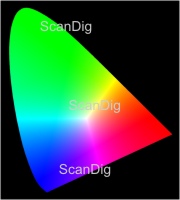
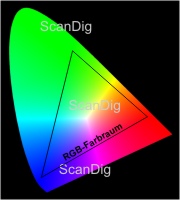
From the CIE (Commission Internationale de l'Eclairage) there is the well-known CIE diagram on which edge curve there are all spectral lights and in its interior there are all possible mixture of these spectral lights. Thus in that diagram all possible lights and light mixtures are contained, which can arise from the spectral colors.
Thus a colour model could be like this, for example, that one chooses 100 or 1000 points from the edge curve of the CIE diagram and colour is a mixture of these 100 or 1000 points, defined in fine steps. Such a colour model would cover a large part of the CIE colour model. In practice a pixel on a monitor would have to be composed by 100 or 1000 singular lamps, graphic boards would have to have the dimension of a mainframe computer, and in an ink jet printer there would have to be 100 ink patrones inserted.
The colour models described in the following do without a complete coverage of the possible colour space, however therefore are much simpler to describe and to realize in practice. We can predict, that there are many colour models, which all have their justification and their advantages and disadvantages. They all are only models, which intend to describe the reality as simple and as precisely as possible.
The additive RGB colour model
At the RGB colour model (RGB = Red, Green, Blue) all colours are composed of the three basic colours red, green and blue (RGB) by adding them. So one uses only 3 basic colours, and by mixing them all other colours are created. If red and green are mixed in the same ratio, yellow comes out; red and blue results in magenta; blue and green provide cyan. If all three basic colours are mixed, one obtains white. If all three basic colours are zero, one obtains black. The three basic colours red, green and blue also are called primary colours. Colours which arise by the mixture of the three primary colours, are called mixed colours.
Since mixed colours always are created by overlaying several primary colours, mixed colours are always brighter than basic colours. Example: Yellow forms from the overlay of red and green; so yellow is brighter than red or green; finally it forms by the intensity of two light sources. Always when the three primary colours are overlayed with the same intensity, e.g. 30% red, 30% green, 30% blue, a grey colour tone is created. On a grey skale from 0% to 100% the value 0% corresponds to a pure black, i.e. the RGB values are all zero, and 100% corresponds to a bright white, i.e. all RGB values have their maximum value. In between there are the grey values, which are also called achromatic colours.
The RGB colour model orientates at the human eye, where different receptors on the retina react on these three basic colours. According to the RGB colour model self raying devices like a television screen, a scanner or a digital camera work. At a television screen a pixel is created by three tiny lamps with the colours red, green and blue. If all lamps are off, the resulting image is black. If all lamps ray with maximum strength, one obtains a white image. At a scanner the original is the active light source, at a digital camera the raying motive.
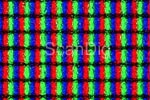
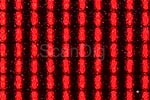
The adjacent two images demonstrate this at a practical example. They contain photos, which are made with a digital microskope. A computer LCD screen with a high resolution was photographed. In the image on the left side we can see, that blue, red and green pixels are in a row a illuminate strongly. Here a white are is displayed at the monitor. In the image on the right side we can see that only the red lamps illuminate, whilst the green and the blue LEDs are off (black); a red area is displayed at the screen. A computer monitor, which has a resolution of 1900 x 1280 pixels, shows each pixel with 3 LEDs, which illuminate differently according to the colour to be displayed. From the more than 2 million pixels, which such a monitor displays, there are only about 60 presented in the adjacent pictures.
The RGB colour model is a device dependent colour modl. Of course one can describe a dark red, for example, with the RGB value of (150,0,0) in numbers, however, how this red tone appears indeed depends on the used device. 10 different television screens display the red value (150,0,0) in a different way, that depends on the colour settings of the individual device. Also 10 different scanners capture a specific red value individually, i.e. device dependently.
With the three basical colours red, green and blue a large number of different colour tones can be created with different mixtures. On a computer monitor, for example, one works with a colour depth of 24 bit, which means 8 bit per colour channel. This means, that both the red and green and the blue lamps of a pixel can display their colours with a colour depth of 8 bit, which means 256 colour tones in total. All in all one obtains 256³ colours, which calculates to 16 million colours. In practice a RGB value is given with a triple of nombers with a range of values between (0,0,0) and (255,255,255). Devices with a colour depth of 16 bit per colour channel, for instance high-value film scanners, have a value range between (0,0,0) and (65536,65536,65536).
I want to emphasize again, that the colours are composed additively in the RGB colour model. In order to imagine that, please make a virtual trip in the universe, where there is nothing than darkness. If a lamp illuminates red light, from the Nothingness becomes red. If a second lamp illuminates green light additionally to the red light, both lights add to yellow. If finally a third lamp emits blue light and hits the yellow light, we will see a white light colour. Thus black is the colour which represents the nothingness. White is the colour which characterizes All.
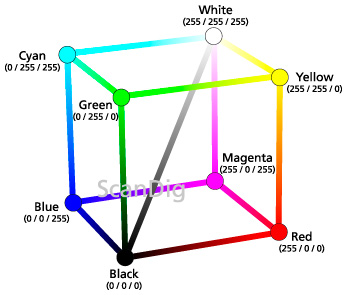
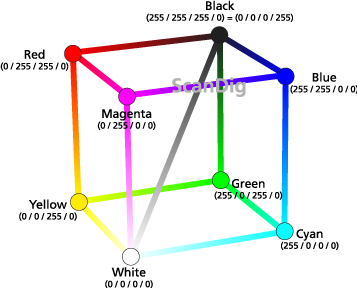
How can we visualize the additive RGB colour model in a simple way? Since all possible colours of that colour model are composed from the three basical colours red, green and blue, a three dimensional visualization in the form of a cube appears suitable. In the origin of the three dimensional coordinate syste there is the colour black with the RGB value (0,0,0).
From this origin the three colour achses red, green and blue start. At the end of the three axis (in the graphics marked with small circles) there are the three clear primary colours red=(255,0,0), green=(0,255,0) and blue=(0,0,255). The other cornes of the cube contain the combination colours yellow==(255,255,0), cyan=(0,255,255), magenta=(0,255,255) and white=(255,255,255). All colours of the RGB colour model either lie on the edges of the cube or on the outer surfaces or inside the cube. The diagonal from the origin black=(0,0,0) to white=(255,255,255) contains the grey skale with the achromatic colours.
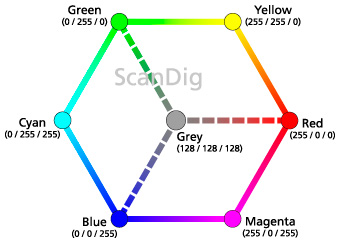
The visualization of the RGB colour model in the form of a cube indeed makes it possibile to visualize all RGB colours in three dimensions, however, in the practice a two dimensional visualization in the form of a colour hexagon is preferred. From the colour cube one obtains the colour hexagon by putting the colour cube on the black corner and squeeze the cube flatly. The adjacent graphics contains the colour hexagon with the corner colours red, yellow, green, cyan, blue and magenta.
In the middle of the hexagon there is the black tone or the grey tone respectively. You also can imagin the colour hexagon as a an intersection through the colour cube. Dependent on the layer you make the cut you have a grey value in the middle in the range from black to white.
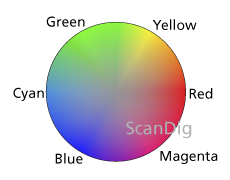
From the colour hexagon it is only a small step to the often used colour circle. You just round up the edges of the colour hexagon and you will get a colour circle with the 6 basical colours red, yellow, green, cyan, blue and magenta, each with an angular distance of 60° to each other. In the middle of the colour circle there is an achromatic colour, which is a grey tone between black and white. The angle in the colour circle characterizes the colour tone, the distance from the center of the circle gives the saturation. With these two terms we are already at the following HSB colour model, which can be derived directly from the RGB colour model.
The HSB colour model
The RGB colour model described in the previous chapter is perfectly suitable for describing a colour in numbers. With en RGB value of (200,200,0) you can easily imagin from which components the colour is composed, and the RGB colour (200,200,0) can be replicated on different computer programs and on different output devices. However, often it is hard to describe a colour from the colour values in the RGB colour model. Can you describe, which colour comes from the RGB value of (217,150,97)? And you do even harder, to compare colors in the RGB colour model: How do the colors (217,150,97) and (199,168,102) differ?
In order to describe colours better and to compare them with each other, there is the HSB colour model. The 3 letters mean Hue, Saturation and Brightness. The hue is described in an angle between 0° and 360°, while the saturation and the brightness are procentual values between 0% and 100%. Even if it seems to be a bit strange to describe a colour in the form hue, saturation and brightness, you just use these descriptions in your daily life, although you are not aware of that. For instance, if you describe the colour of your car with bright neon blue you mean the hue with the word blue, you mean the saturation with the word neon and you mean the brightness with the word bright. In numbers this colour could look like this: HSB=(240°, 80%, 90%).
In the HSB colour model the colour tone (hue) is given as an angle on the colour circle. On this the 6 primary colours red, yellow, green, cyan, blue and magenta are cantained in an angle of 60° each counterclockwise. Examples: The angle of 60° corresponds the colour yellow, at an angle of 120° we have the colour green, and at an angle of 240° we find blue. Two colours can be compared with each other by the angular difference. Yellow and green have an angular distance of 60°, which means that they are quite similar. Yellow and blue have an angular difference of 180°, the maximum possible difference between two colour angles. Thus yellow and blue differ at maximum from each other. One designates these colours as complementary colours. Further complementary colours are red and cyan, as well as green and magenta.
If two colours in the colour circle have an angular distance of 180° then these two colours are complementary to each others; they are designated as complementary colours.
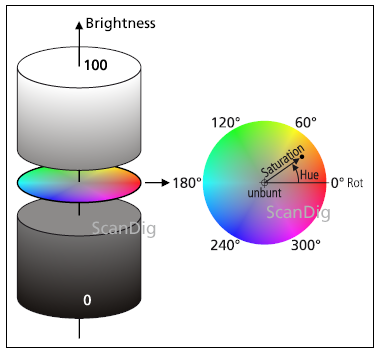
The HSB colour modell can be visualized either as a cylinder or as a bowl, where the just described colour circle has the cross section of a ton or a bowl. On the colour circle the hue lies on the angle; the radius of the circle corresponds to the saturation, whereas the radius of 0 means a saturation of 0% and the maximum radius a saturation of 100%. Colours with a saturation of 0% are designated as achromatic colours; they are grey tones from black to white. In the middle of the colour circle there is also a grey tone. If the cylinder or the bowl is intersected near the bottom it is a dark grey (down at the bottom it is black). At an intersection in the upper area there will be a bright grey (at the top white). In the daily life saturation is described with words like fade, pale, fade, neon or luminous.
Colours with a saturation of 0% are designated as achromatic colours. They are grey tones from black (brightness=0%) to white (brightness=100%).
The brightness is also given as a percentual value in the HSB colour model. In the cylinder model the brightness goes from the bottom to the top or from 0% (black) to white (100%) respectively, whereas the cylinder axis corresponds to the achromatic colours, thus forms a grey skale from black to white. The lids of the cylinder are completely black or completely white. The achromatic colors black and white namely have neither a hue nor a saturation. This fact is better visualized in the bowl model, since the poles of a bowl neither have a radios nor an angle.
Like the RGB colour model and the CMYK colour model also the HSB colour model is device dependent. With the help of ICC profiles however, device properties are describable and correctable. While the RGB colour model represents colours by a mixture of red, green and blue in numbers, the HSB colour model describes colours with colour properties (hue, saturation and brightness), which can be compared easily with each other.
The HSB colour model is especially suited for describing colours intuitively and for comparing colours with each other.
Comparison of the RGB colour model with the HSB colour model
In the previous chapters we have got to know the RGB colour model and the HSB colour model. With both colour models the same colours can be described. In the RGB model a colour is described as a number triple of the three base colours red, green and blue, each in a value range between 0 and 255. In the HSB colour model a colour is described as a number triple of hue(0°-360°), saturation (0%-100%) and brightness (0%-100%).
Both colour models are device dependent. This means, that colours are described uniquely in numbers, but that it is not described how the colour has to be represented in an output device (for example a screen). In order to describe colours in the RGB or HSB colour model absolutely an ICC profile is required, which brings the device dependent colours into a device independent colour model. You can find details to this topic on our website Introduction to colour management.
The RGB colour model describes colours as a compound ratio of the three basical colours red, green and blue. Thus the RGB colours are especially suitable for devices like monitors or displays, which can display almost any colour on the basis of these 3 basical colours. The HSB colour model describes colours more intuitively with the 3 comonents Hue, Saturation and Brightness. While a technical device like computer monitor can display a colour immediately with a given RGB value, the human hardly can handle an RGB value like (217,150,97). Reversly a computer monitor cannot display an HSB value of (240°, 80%, 90%), while a human can easily imagine a specific blue colour with that values.
The RGB colour model is suitable for technical devices like computer displays where colours are created as a composition of 3 bas colours red, green and blue. For the intuitive colour description and for colour comparisons the HSB colour model is better.
Let us finally make a practical test with Adobe® Photoshop® in order compare colours in the RGB model directly with coloursin the HSB model. The professional version of Photoshop® (CS versions) include colour selectors, which show the RGB values and the HSB values for selcted colours. In the elements version only the RGB values are displayed.
Hue
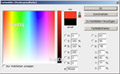
We start with the hue in order to understand the relationship of the base colours with the colour circle angles. First we look at the bas colours of the colour circle by using different angles (hue)
with 100% saturation and 100% brightness. The adjacent 6 figures show how the angles of 0°, 60°, 120°, 180°, 240° and 300° represent the primary colours red, yellow, green, cyan, blue and magenta. These base colours have the well-known RGB values red=(255,0,0), yellow=(255,255,0), green=(0,255,0), cyan=(0,255,255), blue=(0,0,255) and magenta=(255,0,255). The variation of the hue can be done in the left quadratic field over the horizontal x-axis. Let us summarize:
A clear colour in the HSB model with brightness=100% and saturation=100% is given in the RGB model with maximum two values, for example (255,50,0) or (255,0,0).
If we shift the slider in the quadratic colour field slowly from left to right we will recognize that only the H-value varies at the HSB values, while at the RGB values always two numbers change; the third remains constantly at 0.
Brightness
Now we vary the brightness at 100% saturation at a colour angle of 0°, which corresponds to a red colour. The adjacent figures show the red tone in 3 brightness steps 100%, 75% und 50%.
While the red colour is very bright with a brightness value of 100%, the 75% value results in a dark red, and with 50% brightness it does not appear as a clear red any more; it results more in a kind of red brown. By looking at the appropriate RGB values one easily recognizes the effect of the brightness: 100% brightness corresponds to a maximum red of (255,0,0), where the red value reduces with the brightness over (192,0,0) to (128,0,0). If we continue to reduce the brightness, the red brown colour goes into a black (0,0,0) tone.
If we vary the brightness at 100% saturation for the colour yellow (colour angle 60°) we recognize how from a bright yellow with RGB=(255,255,0) at 90% brightness a darker gelb green with RGB=(230,230,0) and at 60% brightness a kind of maple green with RGB=(178,178,0) arises. Like before the RGB values go to black if we continue reducing the brightness. In Photoshop® the brightness is set with the vertical colour bar from 0% (bottom) to 100% (top).
The brightness of a colour is set with maximum two numbers in the RGB model, which characterize a clear hue.
If we move the vertical brightness controller up and down at the HSB values only the value for the brightness B chanes, while at the RGB values both numbers, which characterize the colour, are changed; the third number remains constant in the RGB valules.
Saturation
At the variation of the hue in the HSB colour model we have simply recognized the effect in the RGB model: The corresponding red, green and blue tones got values, for instance (255,0,0) for red or (0,0,255) for blue. At the variation of the brightness in the HSB model the corresponding number for the colour value in the RGB model was changed, for instance from (255,0,0) to (128,0,0) with half the brightness. Now, which effect has the variation of the saturation in the HSB-model to the values in the RGB model?
Let us have a look at the adjacent graphics in which for the hue red (H=0) at maximum brightness (B=100) the saturation is reduced from S=100 over S=90 to S=70. We notice, that the illuminating red at the maximum saturation changes more and more to a dull flamingo red. When looking at the corresponding RGB values we notice that from the clear red with (255,0,0) at 100% saturation a mix colour of (255,25,25) at 90% saturation and (255,76,76) at 70% saturation comes up. Thus the Red value keeps its maximum value of 255 due to the 100% brightness. With decreasing saturation hoever green and blue colours are added in an equal ratio, which corresponds to an addition of cyan. Cyan is the complementary colour of red. So let us summarize:
When reducing the saturation from 100% to an arbitrary value the complementary colour is added to the clear hue.
Let us make the same experiment with the colour yellow (H=60) at maximum brightness (B=100). The adjacent graphics show how the strongly illuminating yellow becomes more and more pale when the saturation is decreased starting from 100%. The corresponding RGB values show how the complementary colour is added when the saturation is decreased. By looking at these figures we also notice how the saturation is visualized in Photoshop®: It can be set in the quadratic colour field over the vertical axis, where at the bottom there is the 0% saturation and at the top there is the 100% saturation.
The subtractive CMYK colour model
The RGB colour model is a simple model for describing the composition of light from different light sources. In nature, however, colours not only are created by lights but also - and even at most - by reflexion and absorption. A yellow flower on a green meadow does not appear as yellow because it radiates yellow light, but rather because it absorbs and reflects the incidenting white sun light in a way that a yellow colour impression comes out. At night no light falls on the flower, so we cannot see it, since it does not radiate actively. What does it mean in detail? The flower absorbes most colours from the sun light, which is composed of the complete colour spectrum, except for the yellow one. The yellow part of the sun light is reflected and is percepted by the observer.
So the colour yellow does not develop by an additive colour composition of the basic colours red and green in the RGB colour model but by a subtractive colour composition. From the white sun light the red and green parts are subtracted - easily spoken -, so that yellow remains. According to such a subtractive colour mixture the CMYK colour model has been developed. In order to understand the RGB colour model we have made an excursion into the universe, where we actively brought light into the nothing. In order to understand the CMYK colour model we remain on the earth where we find white sun light at day; so at the beginning everything (all colours) is there.
If we filter out the red parts from the white sun light the colour cyan remains. If we wilter out all green parts from the white sun light, magenta remains. The filtering of all blue parts results in a yellwo colour. From these three colours the CMY (Cyan, Magenta, Yellow) colour model is constructed. We obtain the complete colour palette by adding these three colours in different levels.
Which color comes out, when two CMY basic colours like magenta and yellow are mixed? Magenta develops by subtraction of the green part of the sun light. Yellow develops by subtraction of the blue parts from the white sun light. THus if the green and blue parts of the sun light are filtered out, only the colour red remains. At the addition of the two CMY colours magenta and yellow the two subtractive effects add and the result is the colour red. So the addition of cyan, magenta and yellow means the subtraction of red, green and blue from the white sun light. It remains nothing, i.e. black.
Not it becomes clear why an ink jet brinter does not have ink cartridges in the colours red, green and blue, but rather in the colours cyan, magenta and yellow. Like at the sun light the starting point is a white paper, which reflects light. If we fill cyan, magenta and yellow on the white paper, everything becomes black. However, since this kind of black is not black enough, an additional forth colour, i.e. a forth ink cartridge, with a real black colour is used. There does the designation CMYK (K means Key) come from. All colours of the CMYK colour model are either inside the cube or on the cube edges or on the cornes of the cube.
The CMYK colour model can be visualized as a colour cube like the RGB colour model. The lowermost corner of the cube contains the basic colour white (0,0,0,0); from this origin the three axes cyan, magenta and yellow start. At their end they have the values cyan=(255,0,0,0), magenta=(0,255,0,0), yellow=(0,0,255,0). The diagonal of the cube contains the achromatic colours, which are the grey tones between white and black. Black is at the end of the diagonal and has the maximum value of the 3 basic colours black=(255,255,255,0) or the maximum value of the key color (0,0,0,255).
The subtractive CMYK colour model is device dependent like the additive RGB colour model. For instance with a CMYK value of (0,0,255,0) a yellow colour can be described clearly, however, how this colour appears on a printer, depends on the printer itself, the used ink and the printer paper.
Colours and colorants
If I irradiate a wall with a red, a green and a blue studio spot an almost white spot can be seen at the wall, like we can expect it according to the RGB colour model. But which color comes out when I paint on a white piece of paper first with a red, then with a green and finally with a blue felt pen, maybe again a white paper? Never ever some bright colour comes out, but rather more a dirty brown-black color.
At this point I want to explain that the word colour often is not used correctly and much more ambiguously. The word sometimes is used as a colour perception and sometimes for defining a colorant. The colour perception is what our brain makes, when an electromagnetic radiation in the range of visible light hits our eye. A colorant is what we use in order to paint a wall or in order to paint on a a piece of paper. When we buy it in a hardware store, we buy paint. After painting the walls they have a specific color.
Back to our initiating question: A spotlight is an active light source which emits a specific light, which can be added to a new colour in combination with other spot lights, when they overlay each other. A red felt pen is a colorant which absorbes the blue and the green parts of the sun light when it is painted on a piece of paper, which reflects the sun light. The same holds for a green and a blue felt pen. If these three colorants are overlayed, almost all light parts of the sun light are absorbed and according to the subtractive colour model an almost clear black colour comes out.
While lights mix additively, colorants are mixed subtractively, which means that a a composition of two colorants their subtractive effect adds up.
Back to the index colour management
|
|
)
)
)
)
)
)
)
)
)
)
)
)
)
)
)
)
)
)
)
)