|
Density and density range of scanners
Those who buy a scanner, no matter if it is a filmscanner, a flat bed scanner or a combined device, will find stated in the packaging and/or in the manufacturer information at first normally the optical resolution as a hallmark and/or as an attribute of purchase decision. In our website Resolution, a detailed text in this concern is written and one specially gains certainty about the fact that the manufacturer information partly have little in common with the actual resolution.
As a second quality attribute for scanners one finds, most of the times written in smaller characters, the density range of the scanner. While one can make straight a use of the information about the resolution and get a concrete idea about that, the density range is a numerical value that can be only correctly interpretaded by professionals, even if the layman understands that the density range is a lower one-digit value and the higher this numerical value is, the better is the scanner. I want to compare this with the features of a car: while everybody imagines a huge harnessed team of 200 horses under the information of 100 hp, only few people can get an idea of what is the information of a moment of a torque 170 Nm about.
But the density range of a scanner is not a clear numerical value for which there are clear rules to handle it. No, every manufacturer uses this information of performance in a different way. While one manufacturer declares the actual density range of the scanner, the other states the maximum density as the equivalent value, and another one declares the density range as the total spectrum that cannot be achieved within one single scan.
For those interested in technology and physics, the following article should shed light on the dark on density, density range, maximum density and minimal density. Without getting too deep into science, I will derive those terms and their significance of physical facts and will represent their significance in a visual way. Those who skip the physical background should also get a clear idea by reading the next chapters what the terms around the density are about and which numerical values do mean what in the practice.
Reflexion, Absorption and Transmission
Before we turn to the term of density, we first have to handle some physical background that is familiar to everybody from the daily life. It concerns what will happen if some rays fall on a medium and/or an object, specially on the effects of reflexion, absorption and transmission. In this concern, let us look at a simple example that everyone knows from the everyday life of a hot summer day: a car is parked outdoors and the sun rays fall straight on the vehicle, as it is visible on the following picture in which we pay special attention to the front windscreen.
In the picture, we can see the light rays that touch the front windscreen. The ray no. 1 is reflected by the glass. We know this effect, as ourselves, we are also sometimes blinded from the exterior by a car window, when the sun ray falls at a certain angle. We also experience this effect by drinving behind a car and the sun falls at its back window in a way that blinds us. This is a reflexion, thus, a mirroring. If some light rays fall on a glass pane, a part of them is reflected. Physically spoken, the part
 of the total of the light rays that incident and are reflected is measured with the help of a so called grade of reflection. The grade of reflection ρ is calculated from the relation of the reflected intensity IR to the incidental light intentity I0.
The radiant power that flows through a certain surface is called intensity. For more information in this concern, please visit our site about photometry. It is not neccessary to be further engaged to this term in order to understand the grade of reflection. One simply has to memorise that the grade of reflection denominates that part of the incident light that is reflected by the medium (the glass pane).
Let us now look at the light ray no. 2 at the upper picture. It incidents the car window and is absorped by it, thus, practically swallowed. We also know this effect from the everyday life, as a windscreen heats up
 by the incident solar radiation. We cannot indeed fry some eggs on the front window like we are able to on the bonnet, but we do notice a clear heating when we leave our car at the blazing sun. If a medium like a glass pane swallows the indcident energy ray, physically spoken it is an Absorption. The quotient of the absorbing light ray IA to the total of the incident light radiation I0 is called Grade of Absorption α. It indicates which part of the incident light rays on the windscreen are going to be swallowed by it.
Finally, we look at the light ray no. 3 of the upper picture. It drifts through the windscreen
 and incidents somewhere in the interior of the car. We of course know the effect of such light rays from the daily life insofar, that the interior of the car is sunny, after all, we are talking about windows... In physics, when light rays go through a medium, it is called Transmission. The quotient of the light intensity that passes IT to the total of the incidenting light intensity I0 is called Grade of Transmission τ. Thus, the grade of transmission indicates the part of the incident light is passing through the medium.
Now we got introduced to the three key data that are grade of reflection ρ, grade of absorption α and grade of transmission τ. The range of each of these key data is between 0 and 1. As an example, a grade of reflection of 0 means that no light is reflected at all, while a grade of reflection of 1 means that the total of the light is reflected by the medium. In the nature, extreme numerical values like 0 and 1 practically never emerge, rather such as 0,0001 or 0,9999.

Thus, a light ray that incidents a medium is either reflected (mirrored), absorped (swallowed) or transmitted (passed through)by it. As a result, the sum of the grade of reflection ρ, the grade of absorption α and the grade of transmission τ is always 1, that is again mathematically represented by the adjoining equation. In order to close this subchapter, let us resume again the most important results of it:
By incidating a medium, the light is either reflected, absorped or transmitted. The part of the reflected, absorped and transmitted radiation is described with the quotient of the grade of reflection, the grade of absorption and the grade of transmission.
Finally, I would like to mention for the sake of completeness that the sum formula above could be amplified by a grade of dissipation. But in the following, it is the light permeability of a material what only concerns us, thus its grade of transmission. We resume the reflection, absorption and eventually the dissipation into lightimpermeability.
Opacity (Light impermeability)
In the previous chapter, we have learned the basic terms of reflection, absorption and transmission. Even if we probably have described these physical phenomenons as a formula for the first time in our lifes, these effects and terms are familiar and current to us from our daily life. In this chapter, we have to acquire a new term that is surely unknown to 99% of the readers. it concerns the lightimpermeability of a material that is called opacity. But more of that later.

In the previous chapter, we learned that the grade of transmission τ indicates which part of the incidenting light will pass through a medium. A grade of transmission of 1 means that 100% of the incidenting light will be transmitted; on the other hand, a grade of transmission of 0 means 0% of transmission, thus nothing will get through. Thus, the grade of transmission is an indicator for the light permeability of a material. If we take the reciprocal of the grade of transmission, then we get an indicator or the lightimpermeability or the turbidity of a medium, and this is exactly what is named opacity. The respective adjective is opaque and it is originated by the latin word opacus (shadily).
Thus, the opacity O is calculated from the reciprocal of the grade of transmission τ. Accordingly, a material that is 100% light permeable (τ=1) has an opacity O=1. If a material only lets 10% of the incidating light through, its grade of transmission is τ=0,1 and accordingly, the opacity is the reciprocal O=1/0,1=10. If a material only lets 1% of the incident light intensity through itself, its grade of transmission is 0,01, whereas its opacity is 100. The following chart shows this relation for an array of numerical values compared to each other.
In the last column, the chart shows symbols for slide frames that should symbolize the colour that belongs to the respective opacity. A slide with an opacity of 1 lets the entire incident light through; this case is symbolized with a non framed slide, whih means the incident light does not have any obstacle, thus it can pass through undisturbed. An opacity of 10 and/or smaller than 10 equals an extremely light film surface (white picture). The light grey picture elements have an opacity around 100; the dark grey shades up to 1000, and in the area of ten thousand are the black shades, that can hardly be distinguished from each other due to their darkness. Lets us resume the knowledge of this chapter:
The opacity is a measurement for the light impermeability of a material. The opacity has a minimum value of 1, if the material is 100% light permeable, and the value of the opacity gets infinite the more impermeable a material is.
Density, Range of Density, Minimal Density, Maximal Density
After we learned in the previous chapter the term of opacity and its signification, it is only a little step left to understand the term of Density. The density is calculated straight from the opacity by taking its tenner logarithm, see the adjoining formula. I explain in the further text the advantage of using the logarithm, but let us look first at some numerical values and their calculation.
An opacity of 1 means that 100% of the incident light passes through the material. The tenner logarithm of 1 is 0, that means that such a material has a density of 0, see the first row of the following chart. A material that does not make any resistance to the light, thus does not absorp and neither reflect anything, is of a density of 0. In a scanner, this would be equivalent to an empty slide frame.(see frame symbol in the irst row). A slide frame with a very light picture with an opacity of 10 lets approximately 10% of the light through; the respective density is calculated to 1. To an opacity of 100 (1% of the light is transmitted), the density of 2 is equivalent, etc. Thus, the scale of density is linear and starts with a value of 0. Let us again call the definition of the density to mind:
The density is calculated b the logarithm of the opacity. A completely light permeable material has a density of 0. The higher the density of a material, the more light impermeable it is. From a density of 5, it can be said that the material is completely light impermeable.
Now we know the term of density as a measurement for the light impermeability of a material. Now we come to the terms Maximal Density, Minimal Density and Range of Density. In this concern, let us have a look at the following picture. it is concerning a waterfall in Mauritius, of which I took a photo diagonally against the sun. As the sun does not come from the back, the
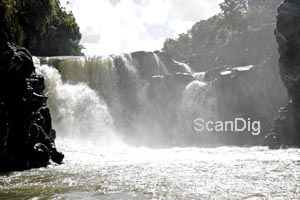 cliffs appear to be very dark and the clowds in the sky extremely light. The most light part of the picture is somewhere in the white clowds, the darkest zone in the cliffs at the left side. If I put this slide into a slide frame and let the light o a projector or a scanner pass through it, I will notice that in the areas of the light clowds, approximately 10 % of the incident light and in the areas of the dark cliffs approximately 0,3% of the light is transmitted. Thus, at the lightest area, my slide has a density of approximately 1; this value is called Minimum Density Dmin. At the darkest area, my slide has a density of approximately 2,5; this value is called Maximum Density Dmax. From the difference between the maximum density Dmax and the minimum density Dmin, the Range of Density D is calculated.
 Thus, our picture has a range of density of D = Dmax- Dmin = 2,5 - 1 = 1,5.
Let us visualize again our numerical values: If we use a non-framed slide it is absolutely light permeable and it is equivalent to a density of 0. If we frame the picture above in a slide frame, then the slide is, depending on the luminosity, in different areas differently light permeable. In the areas of the most bright clowds it lets the most light pass through, the slide has a minimum density of approximately 1,0. In the areas of very dark cliffs it lets the fewest light pass through; here, the slide has a maximum density of approximately 2,5. In between, there are practically all gradations between 1,0 and 2,5. From the difference of the maximum density and the minimum density, the range of density of approximately 1,5 results for this slide. If we framed a small black metal plate, it would be practically completely light impermeable; its density had then a value of 5 or higher. Let us resume this knowledge in a grey box:
A picture has in his brightest area its minimal density Dmin and in its darkest area its maximum density Dmax. The range of density of the picture is calculated from the difference of the maximum density and the minimal density. In the case of films and/or photographies, instead of using the term range of density, people also often talk about Range of Contrast.
The whole derivation of the definition of the density with transmission, opacity, logarithm, etc. is not needed to be memorized. What is important is that the terms of density, minimal density, maximal density and range of density can be distinguished. And it is important to know some guide values for the values of the density: the best is to memorize that a density of 0 means complete transparency while a density from 5 upwards represents a complete impermeability (blacking). In the areas between 0 and 1 there are plenty of white shades, between 1 and 2 light gray tonal values, betweeen 2 and 3 medium tonal values of gray, between 3 and 4 dark gray shades and between 4 and 5 dark black shades.
The question why people deal with the logarithmical density and not straight away with the opacity is still left. It can be clearly said that with a linear scale of density for each range of gray (see previous paragraph) there is a digit of density. A range of density of 1,5 as it is the one of the picture above is then equivalent to such ranges of 1,5. With a maximum density of 2,5 and a minimum density of 1,0, it is easier to handle than with a maximum opacity of 316 and a minimal opacity of 10 and/or a difference of 306. To a difference of density of 1, approximately 3 aperture stops are equivalent in a camera, independently of the range of density we actually are. In the opacity, a difference of 50 of little values is equivalent to a completely different picture, in case of very large values it practically does not have any effect.
Range of density of scanners
In the previous chapter, we learned by an example (see picture no. 2) that an original has a certain range of density from its brightest and darkest area. In the case of film material, photographies or digital photographies it is also talked about the Range of Contrast of the picture. Now we bridge to the range of density of filmscanners and flat bed scanners. A scanner elaborates light signals that incident on a ccd-chip and/or its ccd-line.
 In the image no. 3, the interior of a scanner is schematically represented: a light source (or example a set of red, green and blue LED) transilluminates a film original (a slide or a negative), and behind it, the transmitted light signals incident on the ccd-elements. In between there is, like in a camera (objective) a more or less sophisticated optic connected. The delineation makes clear why in the case of film material it is talked about transparencies. The slide has a cetain range of contrast, for example 0, if it is not framed, from 0,5 to 3,5 in the case of normal slides or even 5 if it is practically light impermeable. But what does the ccd-sensor measure and/or the complete system in a scnner that consists on a light source, optic and ccd-line?
In an ideal scanner, the range of measurement is from a minimal density of 0 up to an infinite maximum density; the range of density would be infinite. Of course, such a scanner does no exist. In fact a scanner covers a certain range of density, see the following image number 4: in this image no. 4, the upper bar shows a scale of density of 0 to 5. We have learned that a density of 0 practically equivalents to absolute transparency, while a density of 5
 practically means light impermability. In the bar below, the range of density of a cheaper scanner is drawed. It goes from 1 to 4. This means that this scanner only can elaborate those slides that contain some image information within the range of 1 to 4. Images that are extremely underexposed have some densities within the range of 0,5 to 1,0. The scanner can NOT distinguish them any more. In the image no. 4, I represented this by the light gray bar (L = lights). Everything that is below the minimal density of the scanner is handled immediately. Between the brightest white and a very bright gray within a clowd, thus, the scanner does not make a distinction.
The same applies for the very dark areas of the image: if an image is strongly underexposed or if it contains some big parts of shades, then this areas of the image are in a density range between of 4,0 and 5,0. But the scanner cannot distinguish this area any more. Everything that is darker than the dark gray at the maximum density 4 is handled in the same way. Thus, the scanner cannot distinguish a dark black and a very dark gray. This is why in the image no. 4, I marked a uniform range of density between 4 and 5 for the shades.
let us look at the image no. 5 in order to clarify again this fact of the case. Our scanner has a minimal density of 1 and a maximum density of 4, thus a range of density of 3. This scanner should scan 3 images now, a very bright and overexposed image, a normal image and an underexposed image. The range of contrast of the overexposed image is emphasized by the first bar with a minimal density of 0,5 and a maximum density of 3. In this image, our scanner cannot distinguish the exremely bright areas. All areas of the image that are in a range of contrast between 0,5 and 1 are handled equally and are not gradated anymore.
The range of contrast of the image with a normal exposition is shown by the second bar with a minimal density of 1,3 and a maximum density of 3,7. In all areas, our scanner can scan this image perfectly, that means that it can represent the full range of contrast of the image. But this is not the case of the image that is strongly underexposed that is shown by the third bar: with a minimum density of 2 and a maximum density of 4,5, it exceeds the range of density of our scanner. Thus, the scanner in use cannot distinguish any more the extremely dark areas of the image in the range between 4 and 4,5 and makes them all of the same colour.
Conclusion: the range of density of a scanner should be as wide as possible so that it can completely represent the range of contrast of different originals. A scanner with a too small range of density cuts the extremely bright lights from the very bright originals and/or the very dark shades from very dark originals off and/or it cannot distinguish them.
A scanner has a certain minimal density and a certain maximum density as also the resulting range of density. Within this range, it can capture completely all colour shades of an original; the colour shades outside the range of density are not recognized by the scanner and/or cut off.
Now it should have become clear to the attentive reader that for a scanner, the range of density does not only matter but also the minimal density and/or the maximum density. For example, a range of density of 3,0 is only aceptable if the range is between 0,5 and 3,5. On the other hand, if the range is between 1,5 and 4,5, the scanner is absolutely inadequate for bright originals. In the other extreme case, such a scanner could not scan properly any dark photographies if its range of density was between 0,0 and 3,0.
Top filmscanners as for example the devices of Nikon, they have a range of density exceeding 4 and this is the reason why they are able to capture a wide dynamic range form very bright up to very dark film material. Some other products state as the range of density the maximum density; in this kind of devices, the range of density is reduced by the minimal density. The reason why the producers do not give a precise information is probably due to their marketing strategies. The unexperienced buyer compares the different numbers of density and might think the higher the numbers the better. Those who have read this article know now what the different statements of the producers really mean.
Relation between range of density and aperture stop
In our derivation above we learned to know the ranges of density and/or the range of density as a numerical value that has a lower one-digit value. In the case of slide scanners, the range of density is given as such a value, for example 3,8 or 4,2. But in the field of fotography, such ranges of density are less used but rather much more terms like Contrast of Object or Aperture Stops. In the following text, I would like to make the relation between the terms.
| Aperture Stops |
Object Contrast |
Range of Density |
| 1 |
1:2 |
0,3 |
| 2 |
1:4 |
0,6 |
| 3 |
1:8 |
0,9 |
| 4 |
1:16 |
1,2 |
| 5 |
1:32 |
1,5 |
| 6 |
1:64 |
1,8 |
| 7 |
1:128 |
2,1 |
| 8 |
1:256 |
2,4 |
| 9 |
1:512 |
2,7 |
| 10 |
1:1024 |
3,0 |
| 11 |
1:2048 |
3,3 |
| 12 |
1:4096 |
3,6 |
| 13 |
1:8192 |
3,9 |
| 14 |
1:16384 |
4,2 |
| 15 |
1:32768 |
4,5 |
| 16 |
1:65536 |
4,8 |
Chart no.3: Relation between the density, the object contrast and the aperture stops
In the chart no. 2, the relation between the transmitted amount of the light, the opacity and the density is applied. Due to the logarithmical calculation of the density, a density difference means a tenfold increase of the transmitted amount of light. 3 points of density even mean a thousandfold increase of the light amount.
By photographing, standarized values of aperture are used; a stage from one aperture to the next (for example from the aperture 5,6 to 4)is characterized by the fact that it doubles the amount of light that incidents the film and/or the ccd-chip. This is the reason why in this concern, people also talk of an object contrast of 1:2.
Thus, a duplication of the light amount equals a contrast relation of 2, and this results in a difference of densiy of approximately 0,3. 10 aperture stops equal a 2tenfold duplication of the light amount, thus a contrast relation of 1024; this is equivalent to approximately 3 densities (thousandfold light amount). The adjoining table no. 3 shows the object contrast of the respective aperture stop as also the respective range of density. The range of density increases by any aperture stop by a value of 0,3. This is a rounded value, as the contrast relation of 1:1024 of 10 aperture stops, provided the calculation is correct, is equivalent to D = log(1024) = 3,01. Thus, the range of density increases if properly calculated per each aperture stop by 0,301. But we will simply memorize the following:
A range of density of 0,3 is equivalent to a contrast relation of 1:2 and in the photography, this equals exactly one aperture stop.
The modern top digital cameras can capture a conrast relation of 1:1024, thus they have a range of density of 3,0 an this equals 10 aperture stops. But we will go deeper into this in the next chapter.
Range of density of some mediums and devices (practice)
Now we have learned enough theory and basics about the terms of density, minimal density, maximal density, range of density, contrast relation, object contrast and aperture stops, so that we can aplly the learned in the practice. First I want to begin with some numerical values for different mediums (films, originals) and devices (scanner, cameras), so that we get an idea in which range of values the important procedures in the field of the photography and scanning happen.
| Medium/Device |
Range of density |
Aperture stops |
| Non-transparent material |
1,5 |
5 |
| Slide (positive) |
2,4 |
8 |
| Negative |
3,6 |
12 |
| Digital camera |
2,7 |
9 |
| Flat bed scanner |
2,1 |
7 |
| Film scanner |
4,2 |
14 |
| Drum scanner |
4,8 |
16 |
Chart no. 4: Ranges of density of some media and devices
In the adjoining chart no. 4, I have listed the range of density of originals and devices, as also th ones of the referring aperture steps. The following image no. 6 visualizes the same information graphically with the support of the already known scale of density from 0 to 5. While in the chart no. 4 the range o density is only listed in size, in the image no. 5 it is also represented by its areas, that means that in the imege, not only the range of density but also the respetive approximate minimal density and maximum density is recognizable. But know we first interpretate the range of density of the photo material. Non-transparent originals have a very low range of density of maxium 1,5 (5 aperture steps); this is logical, as paper does not transmit any high contrasts. On the other hand, a slide film has a range of contrast of approximately 2,4, this is equivalent to 8 aperture steps. The wider range of density of approximately 0,9 compared to the paper photography means that a slide is 10 times more light-sensitive as a paper photography. This is also logical, as with a slide projector in the case of a dark slide people put the room into total darkness, while in the case of a very light slide this room is lightened.
The range of density of a negative is of approximately 3,6, what is equivalent to 12 aperture steps. Thus, a negative film has a much bigger object contrast than a slide film. This is also known by those photographers who have already photographed with both films, as in the case of a slide film the failures of the exposition have a much more grave efect than in the case of negative films. With other words: a negative film forgives the photographer much more mistakes than a slide film.
Modern digital cameras have a range of contrast from 7 to 10 apertures, this is equivalent to a range of density between 2 and 3. But an object contrast of 10 or a little higher only have the professional reflex cameras; the compact low priced models for beginers are in the range of seven but rather below that.
Now we come to the flat bed scanners, film scanners and drum scanners. What do these devices have to perform in order to scan the respective originals in a perfect way? Metaphorically speaking, the respective bar of the scanner in the image no. 6 has to capture the respective bar of the original that is to be scanned. In the case of a flat bed scanner, this is an easy task. In order to digitalize non-transparent orginals of a range of density of maximum 1,5, the simple flat bed scanners are sufficient that often no not even have a range of density of 2.
The flat bed scanners have a very low range of density (often lower than 2), as the non-transparent originals to be scanned have a range of density that is lower than 1,5.
Those who wonder why so many flat bed scanners with an integrated transparency unit deliver such bad results by scanning slides or negatives, will find the answer in the range of contrast of the film material. While the range of contrast of the typical flat bed scanners are in the range of 2,0 that is totally sufficient for paper originals, for the slides and negatives the needed ranges of density are between 3 and 4 in order to capture the full image contrast. The flat bed scanners with a transparency unit often totally fail by completing this tasks. Then the lights are overexposed, tha shades are underexposed, which means that the light areas of the image are equally bight and the dark areas of the picture are equally dark, even if the original shows some signifikant nuances in the lights and the shades.
Innately, film scanner have a bigger dynamic range. The cheap models for beginners already have a range of density of nearly 3, while the top models have a range of density exceeding 4. With this, the full dynamic range of slides and negatives can be captured and the result us a very good image quality. These results can be only topped by the shockungly expensive drum scanners that partly have a range of density up to 5.
Film scanners have a range of density in the range of 3 to 4 and this is why they are able to capture completely the high range of contrast of slides and negatives.
Attention! The Object contrast is not the same as the motive contrast!!!
The image above no. 5 seems to simplifly a very complex issue that is the different contrast relations of originals/films. But I want to point out some effects and methods that make the issue more complicated than it seems to be at first sight. For example, the graphical scheme of the image no. 6 of the previous chapter suggests that the digital cameras which range of density is about 3,5 cannot capture any motives that are darker than for example than those that have a density of 4, for example. But it is not like that!
Let us first visualize how to photograph a very normal and harmless landscape with a digital camera. The image no. 7 shows the object contrast of a simple digital camera in the range between 1 and 3,5. The landscape to be photographed has a motive contrast of 1,3 to 3,0. Thus, the motive can be normally brought to the film and/or the chip with a standard exposition. Thus, the motive seems to be optimally arranged for our digital camera, and/or the way around. How does the camera handle a very dark motive that is taken, for example, during the dawn in the darkness?
In this concern, let us look at the image no. 8. Our night motive is located in a range of density between 2,5 and 4,0, thus actually beyond our range of the camera. As the motive contrast with a value of 1,5 is clearly lower than our object contrast of the camera with 2,5, the night motive can ne easily brought to our ccd-chip by a longer exposition without cutting off valuable details. 2 aperture steps in a stronger iluminated objective are therefore neccessary and/or there is to be exposed 4 times longer with the help of a stand. Thus we recognize that it depends of the size of the contrast of the objective and the motive.
Finally, I want to advise in the concern of digital cameras that the object contrast of a digital camera is not a constant velue at all. The modern digital cameras have the possibility to handle darker motives by the incease of the ISO-number from 100 to 200 without having to expose for a longer time. Therefore, the elements of the ccd-sensor are connected and the image moise increases. Such effects inevitably reduce the contrast of the object, and this is the reason why serious tests of digital cameras always declare the object contrast in conjunction with an ISO-number and/or declare the respective object contrast for different ISO-numbers.
The modern digital cameras reach an object contrast between 7 (odels or beginners) and 10 (models for professionals). In case of higher ISO-settings, the object contrast decreaes significantly.
Attention! The range of density of filmscanners is not always completely available!!!
Of course, the same applies to the filmscanners: the range of density of the scanner has to be higher than the one of the slides or the negatives in order to capture all the details of the original. But in the case of scanners, such a motive contrast cannot be moved without problems inti the range of contrast of the scnner by a longer exposition, as if the scanner cannot nuance the very dark areas of the picture, a longer exposition will also not help.
A decisive question is also if a scanner can reach its full range of density that is declared in the technical data within a scan. If a producer for example declares a range of density for a scanner with 4,2, then it should be possible to expect that in a picture that contains either extremely light details as also extremely dark details, all these details are properly captured and grauated. Unfortunately, it is not like that. A range of densiy of 4,2 can also mean, that in the case of extremely dark photos all details of the shades and in case of extremely light pictures all light details are indeed captured, but in the cae of images that either have extremely and and also extrmely dark areas, not all details are captured. Those producer declarations that are not precise and that are not based in any kind of standard lead to the fact that for the purchase decision of a scanner, only one criterion exists: to test, to try, and the reports of experience.
The declaration of the range of the density of scanners is not based on ant standard. A high range of density does not mean that this range can be used in one scan. This is why the values of experience and the test reports are so significant.
The drum scanners are characterized exactly by the fact that they have a very high range of density and that they can use this range of contrast completely within a scan. Thus, an against-the-light photograph that contains very light details and many nuances in the areas of shade can be digitalized with all its details with the help of a drum scanner. But of course, this performance is pais by a price for this device for which one can already get a medium-sized vehicle.
I want to emphasize this fact with the help of the images no. 9 and 10. A range of density of 4,0 of two scanners is represented, in the image no. 9 it is a top device and in the image no. 10 a less good device. Both devices have a range of density of 4,0 according to the declaration of the producer, but the device no. 1 can capture it within one single scan. Both devices have no problem with an extremely light or an extremely dark motive; the respective range of the contrast is completely captured into the range of contrast of the scanner, in case of a dark shot it is inserted by a longer exposition respectively.
It looks different in case of a motiv that either contains very light as also very dark areas, thus it has itself a range of contrast of 4,0. The top-scanner of the image no. 9 can capture the entire object contrast within one scan and either represents the very light as also the very light areas with enough drawing. All information of the original are digitalized and can be exposed in the image processing program respectively. The scanner of a worse quality in the image no. 10 can indeed capture the densities either in the lower range of 0,5 as also in the maximum range of 4,5, but it cannot do both things at the same time. Thus it cuts off from the original that is full of contrasts a midlle-sized area of the value 3,0, and the brighter lights as also the darker shades get uniformly black. The scan does not have any more al image details, the lights are overexposed, the shades are underexposed. The image no. 10 shows this with the help of the arrows coloured in magenta, that simply leave the left and/or the right part of the motive aside.
Back to the index Know How
|
|